 Pro Features
The Reports tab in Mailspring's Activity view summarizes your mail volume, how quickly you and your contacts reply, and how recipients engage with the messages you send. Every chart is computed locally from the messages in the selected time range — nothing is sent to a server.
To get there, click Activity in the left sidebar and choose the Reports tab at the top of the page.

How the numbers are computed
- Time range. The dropdown at the top right (Today, Last 7 Days, Last 2 Weeks, Last 4 Weeks, or a calendar month) sets the window. Every chart uses the same window, and it's shared with the Feed and Engagement tabs. "Last N days" starts at midnight N−1 days ago and runs through now.
- Accounts. Reports cover the accounts selected in the sidebar: one account, or All Accounts.
- Sent vs. received. A message counts as sent when it is from one of your account addresses, and as received otherwise. Drafts are ignored.
- Excluded mail. Messages in Spam and Trash are not counted anywhere on the page.
- Threads you started. A thread counts as one you started when the first message in the window is yours and is not a reply. A reply you sent to an older conversation is not a thread you started.
- Tracking caveat. Open Rate, Link Click Rate, and the charts derived from them only reflect messages that were sent with read receipts or link tracking turned on in the composer. When fewer than 75% of your sent messages had tracking on, a notice above that section says so.
Mailbox Summary
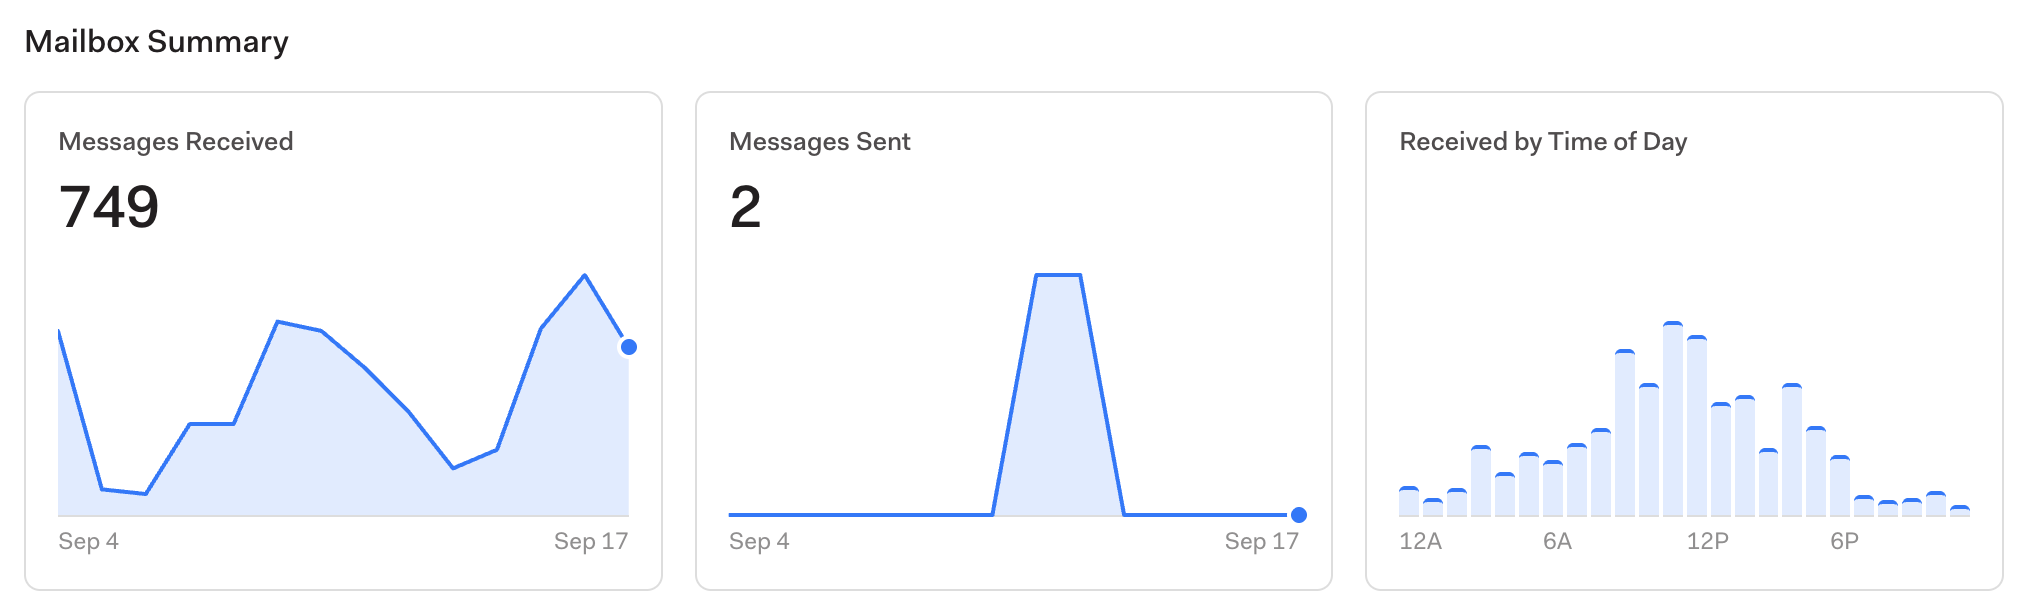
Volume in and out, and when mail arrives.
| Chart | Headline number | What the chart shows |
|---|---|---|
| Messages Received | Total messages received in the time range | Line chart, one point per day. The dot marks the most recent day. |
| Messages Sent | Total messages you sent in the time range | Line chart, one point per day. |
| Received by Time of Day | — | 24 bars, one per hour of the day (12A to 11P, in your local time zone), showing how many received messages arrived in each hour across the whole time range. Hover a bar for the count. |
Messages Received and Messages Sent each use their own y-axis scale, so a tall peak on one chart is not comparable to a peak on the other.
Replies and Response Time
How quickly you answer mail, and how quickly people answer you. These do not depend on read receipts or link tracking.
| Chart | Headline number | Detail line | What the chart shows |
|---|---|---|---|
| Your Response Time | Median time from an incoming message to your reply on that thread | Threads that emailed you and how many you replied to, as a count and a percentage | 7 bars bucketing every reply you sent by how long the sender waited: under 5 minutes, 30 minutes, 1 hour, 4 hours, 1 day, 3 days, or longer. |
| Recipient Response Time | Median time from a message you sent to the first reply, for threads you started | Threads you started and how many got a reply, as a count and a percentage | The same 7 delay buckets, one bar per thread that received a reply. |
Details of the response-time math:
- A thread starts "waiting on you" when a message from someone else arrives. Your next message on that thread ends the wait and records the delay. A thread can be answered more than once in a window; each answer counts once.
- Newsletters and other list mail (messages with a
List-Unsubscribeheader) are not counted as waiting on you, so they do not lower your response rate. - Recipient Response Time measures the first reply only. Later back-and-forth on the same thread is not included.
- The headline shows — when there is nothing to measure in the window.
- Delays under a minute display as "< 1m"; otherwise the headline is rounded down to the nearest minute, hour, or day ("2h 15m", "3d 4h").
Read Receipts and Link Tracking
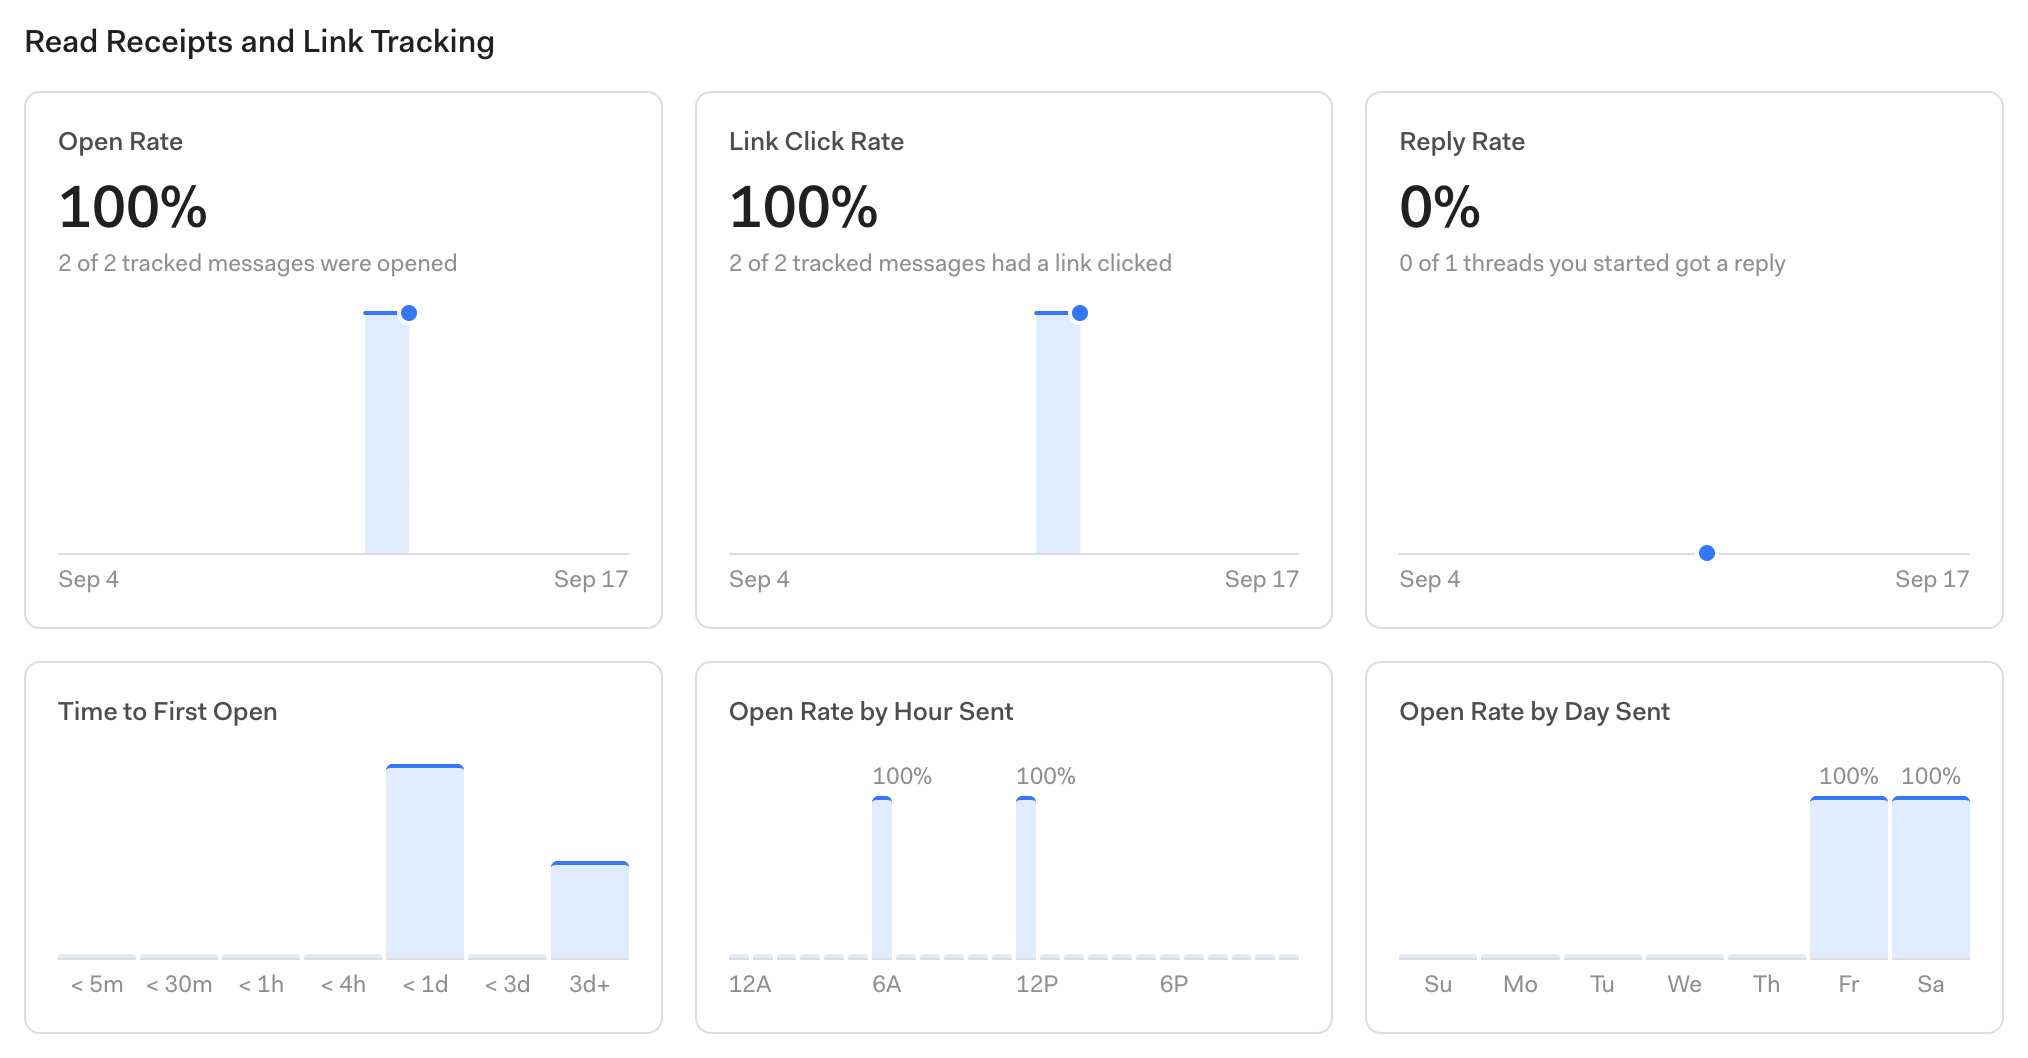
How recipients engage with the messages you sent with tracking turned on. Read receipts and link tracking are enabled per message with the eye and link icons in the composer.
| Chart | Headline number | Detail line | What the chart shows |
|---|---|---|---|
| Open Rate | Percentage of read-receipt messages that were opened at least once | Opened count of tracked count | Line chart of the open rate for messages sent on each day. Days with no tracked messages are gaps in the line. |
| Link Click Rate | Percentage of link-tracked messages in which at least one link was clicked | Clicked count of tracked count | Line chart of the click rate for messages sent on each day, with the same gaps. |
| Reply Rate | Percentage of threads you started that received a reply | Replied count of started count | Line chart of the reply rate for threads started on each day. Does not require tracking. |
| Time to First Open | — | — | 7 bars bucketing how long after sending each recipient first opened a message: under 5 minutes, 30 minutes, 1 hour, 4 hours, 1 day, 3 days, or longer. Counted per recipient, so a message to three people can add three bars. |
| Open Rate by Hour Sent | — | — | 24 bars, one per hour of the day you sent in. Each bar is the open rate for read-receipt messages sent in that hour. Hover for the opened-of-sent counts. |
| Open Rate by Day Sent | — | — | 7 bars, Sunday through Saturday, showing the open rate for read-receipt messages sent on each weekday. |
Best Templates and Subject Lines
A table titled Subject Lines with the Highest Reply Rate. It compares the performance of subject lines you used more than once, which is how templates show up here.
- Rows: one per subject line, for threads you started with tracking on. "Re:" and "Fwd:" prefixes are stripped before grouping, so replies sent from a template group with the original.
- Columns: Messages Sent, Open Rate, Link Click Rate, Reply Rate. Rates show the percentage and the count in parentheses; a dash means zero.
- Sort: reply rate, then open rate, then how many times the subject was used.
- Subject lines used only once are left out. The card shows a note with a link to Templates until there is something to compare.
For example, if you send fifty sales inquiries, 25 titled "Appropriate Person?" and 25 titled "Checking In", this table tells you which subject line is more effective.
Best Links
A table titled Links with the Highest Click Rate, covering every link in messages you sent with link tracking on.
- Rows: one per URL. A message that contains the same URL twice counts once toward that link's Messages Sent.
- Columns: Messages Sent (messages containing the link), Link Click Rate (share of those messages in which the link was clicked, with the count), Total Clicks (every click, including repeat clicks by the same recipient).
- Sort: click rate, then total clicks.
Buttons at the bottom of the page
| Button | What it does |
|---|---|
| Learn More | Opens this documentation. |
| Export Raw Data | Saves a CSV with one row per message in the time range: Sent (true/false), From, To, Cc, Bcc, Date, Subject, Opens, Clicks. For sent messages without tracking, Opens and Clicks read "off". |
| Share this Report | Uploads a static snapshot of the page and shows a link you can copy. The snapshot keeps the charts and tables but drops the tabs, buttons, and account picker. Anyone with the link can view it. |
Related
- The Feed tab lists every individual open and click.
- The Engagement tab groups activity into one card per recipient.
Wish we had metrics that you don't see here? Email support@getmailspring.com and let us know!